Report Guide Library · 2 of 5
How do I read a sea temperature chart for fishing?
Read it for where the color changes, not for the number. Baitfish stack along a temperature step, and the fish that eat them ride the warm side of it. An even sheet of warm water gives them no reason to be anywhere in particular.
This page takes one real chart apart: Alligator Reef, Friday, October 2, 2026. The water ran from 83.8 to 87.0 F, and the part that mattered was a soft step on the way offshore.
The numbers behind the chart
- Zone water, average
- 85.9 F
- Coolest to warmest
- 83.8 to 87.0 F
- The step the report read
- 2.4 degrees across roughly 15 NM
- Where it tightened
- 5 to 10 miles outside the reef line
From the report’s own data: 735 satellite points, 1 km resolution, Alligator Reef, October 2, 2026.
What the chart is showing you
Every color on a sea temperature chart is a temperature, and the legend tells you which. The first picture is the map as the report draws it. The second answers a different question: not how warm the water is, but how warm it is for the date.
Sea surface temperature
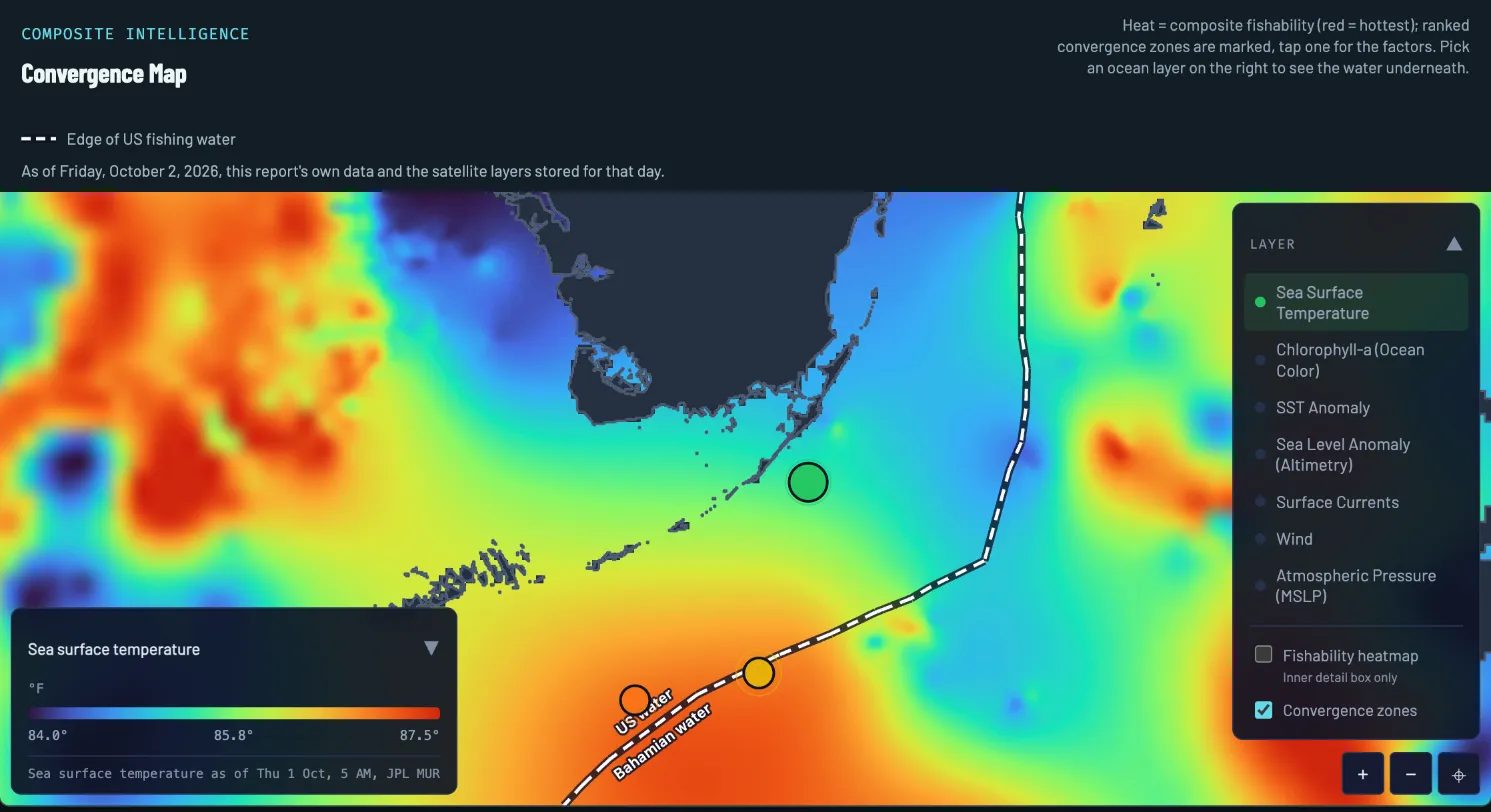
- The day. Drawn from that morning’s report and the layers stored for that day.
- Legend and layer time. Blue is 84.0 F, red is 87.5 F. The stamp under the bar says when the satellite saw the water: Thursday, October 1, 5 AM.
- Cool water. Florida Bay and a cooler band along the outside of the Keys.
- The step. Moving offshore the colors climb from green through yellow to orange. This is the climb the report measured.
- The top of the climb. Orange water to the south of the reef: the warm side of the step.
- Spot 1. The report’s top pick sits where the cool water has started to climb.
- Layer picker. Switch the water underneath. The SST Anomaly layer is in this list.
Sea surface temperature anomaly
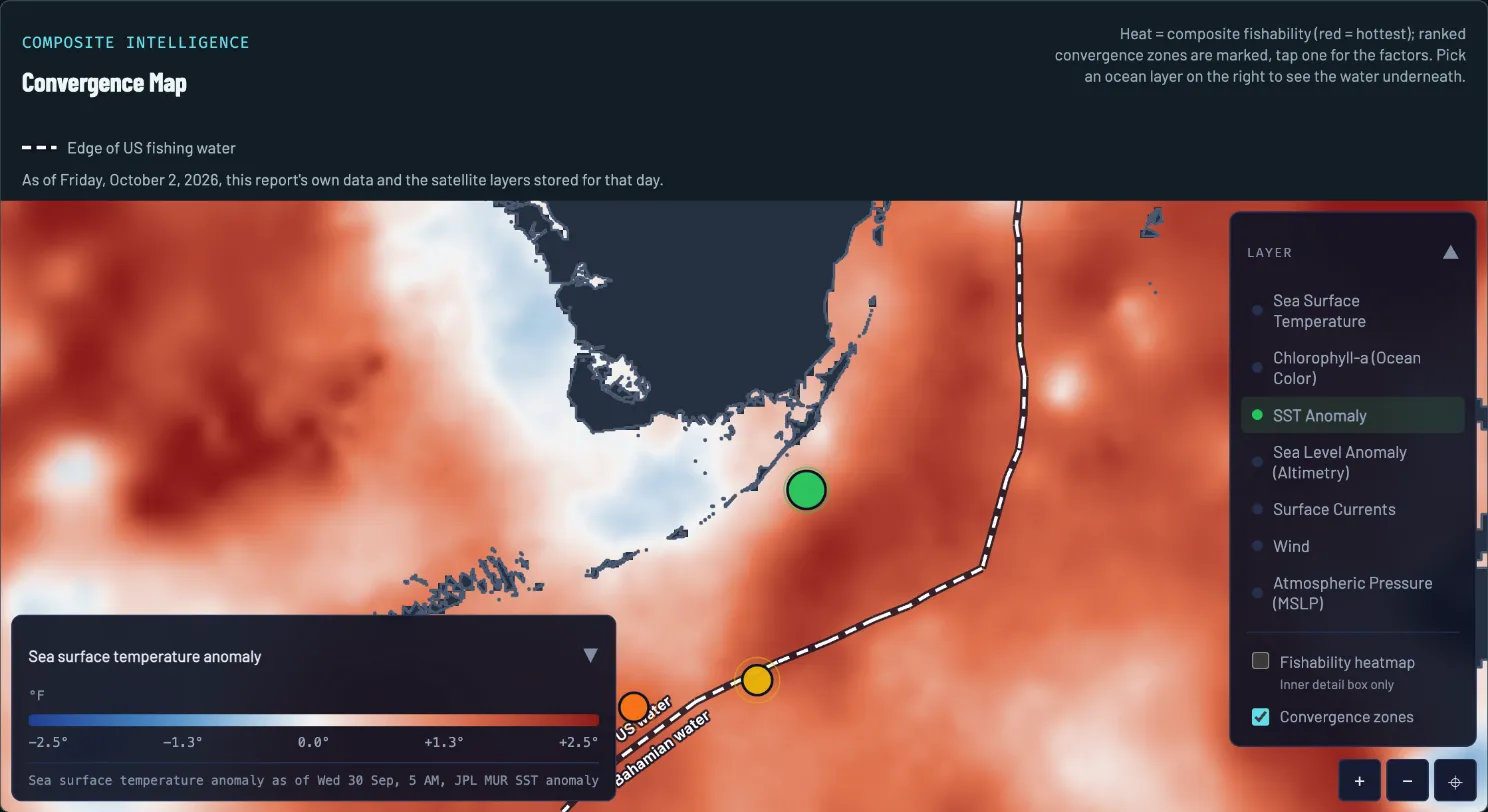
- Legend and layer time. White is normal for the date, red is warmer than normal, blue is cooler. This one runs from -2.5 to +2.5 F, as of Wednesday, September 30, 5 AM.
- Near-normal water. The pale band hugging the Keys and Florida Bay.
- Warmer than normal. Red offshore: most of the frame is above normal for the date.
- Spot 1. The pale water gives way to red a short way offshore.
How to read it on October 2
Four reads, in the order a captain would make them.
-
READ 1
Find the cool and the warm
Cool water filled Florida Bay, and a cooler band hugged the outside of the Keys. Moving offshore from Alligator Reef the water warmed steadily toward a warm tongue the report’s imagery read centered roughly 20 to 25 miles ESE.
-
READ 2
Size the step
The report read the climb as 2.4 degrees across roughly 15 NM: a soft step rather than a knife edge. A knife edge crams the color change into a short distance, so the colors meet in a line. A soft step spreads it over miles, so they blend.
-
READ 3
Find where it tightens
The step runs northeast to southwest, parallel to the reef line, and the imagery read put its tightest part 5 to 10 miles outside the reef. That is the stretch of the step worth a pass first.
-
READ 4
Do not fish the even sheet
The southeast corner of the chart cooled slightly again. A broad sheet of warm water with no step in it is just warm. The edge of the tongue is the feature, not the middle of it.
What to do with it
A temperature step on its own is a maybe. The report’s ranked spots lean on it as one edge among several: on October 2, spot 1 had the temperature break, a chlorophyll front and the report’s eddy factor from its sea level gradient read overlapping, which is why it ranked first. That factor comes from a sea height step, not a closed eddy in the temperature picture. The convergence map page shows how that stacking works.
To check a spot against this chart, about a minute:
- Open the report’s map and switch it to Sea Surface Temperature.
- Find the spot’s pin. Is it on a color change, or in the middle of one color?
- Switch to the anomaly layer. Is the water there near normal, or well off it?
- Read the layer’s time under the legend, then go back to the report’s wind and seas before you decide to run.
What the chart cannot tell you
- It is a day or two old. The layer on this map is stamped Thursday, October 1, 5 AM, on a Friday report, and the report’s data note counts the age of every layer it used. An edge moves; check the stamp.
- It is the surface. A satellite sees the skin of the water, not what is a hundred feet down.
- Clouds blur it. A satellite cannot see through cloud, so the product fills the gaps and edges can read softer than they are. When a day’s preferred source is unavailable the report falls back to a backup and says so in its data note.
- It is not a fishability score. Warm water with a Small Craft Advisory on top of it is still a rough day. The best water tells you where. The forecast tells you whether.
What this looked like on the water
That morning’s report told anglers to troll the warming step where the mid-80s climb toward the 87.0 tongue, working it northeast to southwest, and put its first look 4 to 10 miles off Alligator Reef, where the warming step and the color line overlap. The same morning carried a Small Craft Advisory until 8 PM, so the plan was written around the weather as much as the water.
Questions anglers ask
What water temperature do fish prefer?
There is no single number. Each species and each region has its own comfortable range. What a chart gives you faster than a number is the change: baitfish gather where the temperature steps, and the fish that feed on them ride the warm side.
How big does a temperature break have to be to matter?
There is no magic number, and distance counts as much as degrees. On October 2 the report treated 2.4 degrees across roughly 15 NM as worth fishing, and its own text said about 2 degrees is enough to concentrate baitfish along a boundary. The same change in one mile would be a harder edge than in fifteen.
Why does my boat’s water temperature not match the chart?
A satellite reads the skin of the water as it was when it passed, and your sensor reads the water at the hull right now. Compare the change from one patch to the next, not the exact number.
What is a sea surface temperature anomaly?
How far each patch is from normal for the date. It answers a different question from the plain temperature chart: whether this water is warmer or cooler than usual, which can matter more than the number itself when the whole region has been warm.
Report Guide Library
Learn each chart, one real day at a time
- Read now Convergence map How do I find where fish stack up offshore?
- You are here Sea temperature How do I read a sea temperature chart for fishing?
- Read now Chlorophyll and water color What does chlorophyll tell me about where to fish?
- Read now Currents How do currents and eddies help me find fish?
- Read now Sea level What is a sea level anomaly chart and why should anglers care?
See your water tomorrow morning
Pick your water and get a free report with its own convergence map and three ranked spots.
FishIntel is for information only. It is not for navigation or safety-of-life decisions.