Report Guide Library · 5 of 5
What is a sea level anomaly chart and why should anglers care?
The ocean surface is not flat. Highs are warm water piled up, lows are cooler water drawn up from below, and the steep step between them is where currents run and water masses meet. That is a map of eddies you cannot see from the boat.
This page takes one real chart apart: Alligator Reef, Friday, October 2, 2026, a day with no closed eddy on the chart. Knowing what a quiet chart looks like is how you recognize a busy one.
The numbers behind the chart
- Lowest in the zone
- 0.40 ft
- Highest in the zone
- 0.83 ft, 41.8 NM from the reef
- The step across the zone
- 0.43 ft
- A closed eddy
- None that day
- Age of the layer in the report
- 57 hours
From the report’s own data: Alligator Reef, October 2, 2026.
What the chart is showing you
Every color is a height: how far the sea surface sits above or below its long-term average. Red is high, blue is low, white is average. What matters is where the color changes fast.
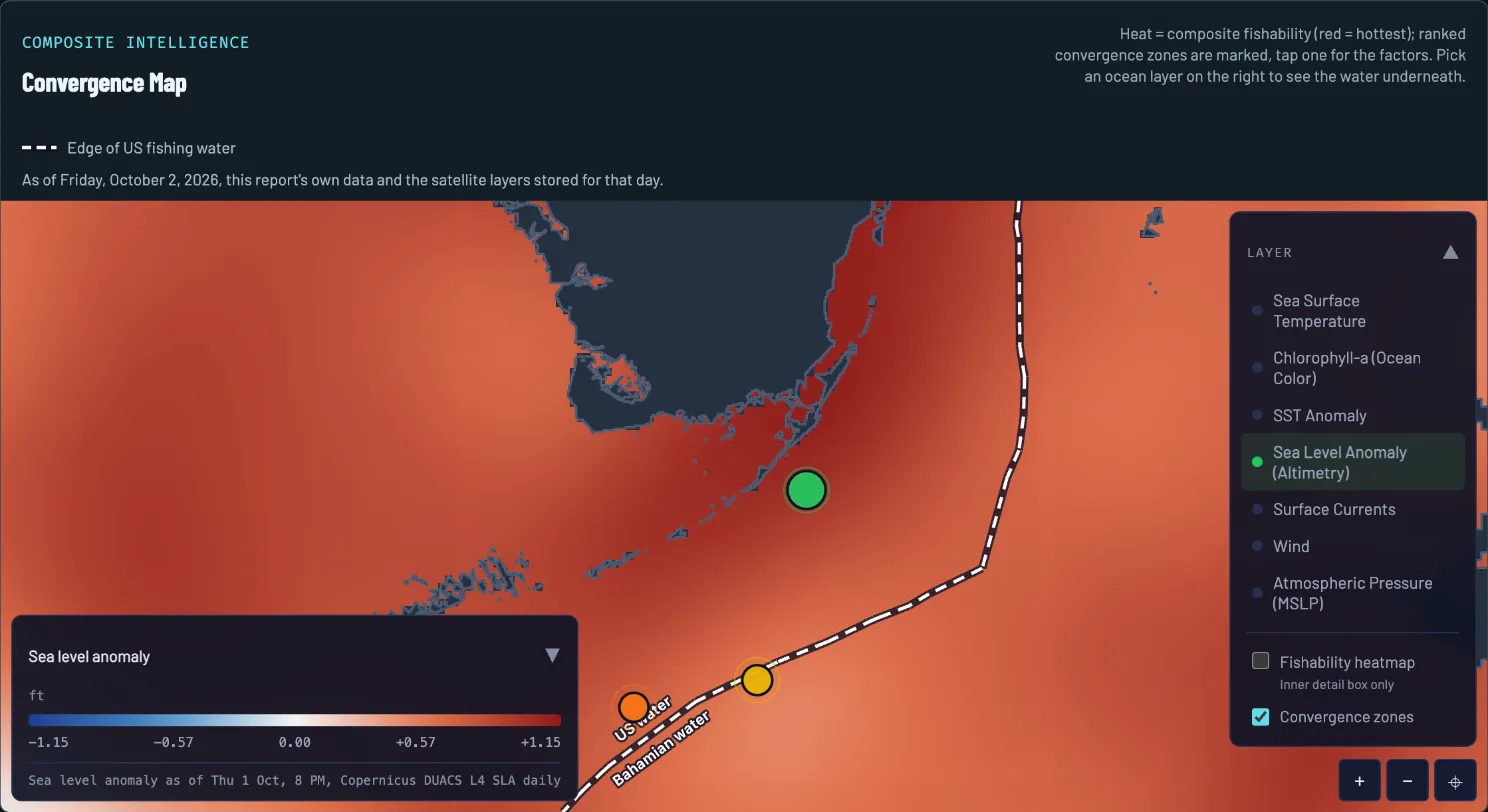
- The day. Drawn from that morning’s report and the layers stored for that day.
- Legend and layer time. Feet above or below the long-term average sea level, from -1.15 (blue) to +1.15 (red). The stamp says the satellite pass was Thursday, October 1, 8 PM.
- The highest water. Darkest red along the Florida coast and the Upper Keys.
- Lower water. Lighter orange to the south and east. Still above average, but lower.
- Spot 1. The report’s top pick. The report’s factors for this spot are a temperature break, an eddy factor from its sea level gradient read (this chart shows no closed eddy) and a chlorophyll front.
- Layer picker. Switch the water underneath. Surface Currents is in this list.
How to read it on October 2
Four reads, in the order a captain would make them.
-
READ 1
Read the sign
Every color is how high the sea surface sits compared with its long-term average. Red is above, blue is below. On October 2 the report called sea level positive everywhere in its frame, so there is no blue to find.
-
READ 2
Size the step
Across the zone the water ran from 0.40 ft up to 0.83 ft, a 0.43 ft step, with the high 41.8 NM from the reef. The report called it a difference in sea height rather than a hard rip line. For scale, on October 8 the same report measured a 0.92 ft step, more than twice as big.
-
READ 3
Look for a closed bullseye
A high with rings closing around it is a warm eddy and a low with rings is a cool one. The report found neither on October 2: no closed eddy, and at that coarse grid the core of the Stream was not cleanly defined.
-
READ 4
Find the slope instead
With no bullseye, the useful read is the slope. On this chart the water is highest along the Florida coast and the Upper Keys and eases off to the south and east. Water moves along those contours, and moves fastest where they crowd together.
What to do with it
Sea level is the slowest layer to change and the best one for the big picture: where the water masses are, and where they meet. The report’s ranked spots count an eddy as one factor among several. On October 2, spot 1 had an eddy factor from the sea level gradient read alongside a temperature break and a chlorophyll front. The spot ranking calls a sea height step an “eddy” factor; the imagery read looks for a closed loop, so the two reads differ without this chart showing a closed eddy. The convergence map page shows how that stacking works, and the currents page shows what the same steps look like as moving water.
To check a spot against this chart, about a minute:
- Open the report’s map and switch it to Sea Level Anomaly.
- Find the spot’s pin. Is it near a step between higher and lower water, or in the middle of one even color?
- Look for a closed patch of red or blue. A closed patch is an eddy, and its rim is the edge.
- Read the layer’s time under the legend, then switch to Surface Currents to see where the water is actually moving.
What the chart cannot tell you
- It is a couple of days old. The layer on this map is stamped Thursday, October 1, 8 PM, and the report’s data note counted its sea height at 57 hours old. Eddies drift and change; check the stamp.
- It is coarse. The chart is built from satellite passes blended onto a grid, and the report said so: at that coarse grid the core of the Stream was not cleanly defined. A small eddy can hide between the cells.
- Two products, two times. The report’s numbers come from one satellite product and the map layer from another, each with its own time. The stamp under the legend tells you which you are looking at.
- A high is not fish. Sea level shows where water masses sit and meet. It does not show where fish are standing, and it says nothing about the day’s wind and seas.
What this looked like on the water
On October 2 the report called it a soft story: a 0.43 ft step across the zone, a difference in sea height rather than a hard rip line, and no closed eddy on the chart. Its top spot, 11.4 NM out, got its score from a temperature break, a chlorophyll front and the report’s eddy factor from its sea level gradient read overlapping, not from a closed eddy or a sea level wall.
Questions anglers ask
What does sea level anomaly mean?
How high the sea surface sits compared with its long-term average at that spot. It is measured from space and shown in feet, with red for above average and blue for below. It is not the tide, which comes and goes every few hours, but the slower hills and hollows of the ocean surface.
Why would sea level matter to an angler?
A hill in the sea surface is usually warm water piled up, and a hollow is usually cooler water drawn up from below. The step between them is where currents run fastest and where different water masses meet, which is where bait and the fish that eat it tend to collect.
How do I tell a warm eddy from a cool one on the chart?
A closed patch of red, a high, is a warm eddy. A closed patch of blue, a low, is a cool one. The rim, where the colors change fastest, is the edge to fish. If the chart is red or blue all over with no closed patch, as on October 2, there is no closed eddy on the chart that day.
How big a sea level step is a big one?
There is no single number. On October 2 the zone’s step was 0.43 ft and the report called it soft. On October 8 it was 0.92 ft, more than twice as big. Judge a step against the legend on the chart you are reading and against the other layers, not against a rule.
Report Guide Library
Learn each chart, one real day at a time
- Read now Convergence map How do I find where fish stack up offshore?
- Read now Sea temperature How do I read a sea temperature chart for fishing?
- Read now Chlorophyll and water color What does chlorophyll tell me about where to fish?
- Read now Currents How do currents and eddies help me find fish?
- You are here Sea level What is a sea level anomaly chart and why should anglers care?
See your water tomorrow morning
Pick your water and get a free report with its own convergence map and three ranked spots.
FishIntel is for information only. It is not for navigation or safety-of-life decisions.