Report Guide Library · 4 of 5
How do currents and eddies help me find fish?
Moving water pushes bait around, and it pushes it together where it speeds up, slows down or curls back on itself. Look for the edge, a fast lane beside slow water, and for the rim of an eddy. Speed tells you how hard the water is working. Direction tells you which way.
This page takes one real chart apart: Alligator Reef, Thursday, October 8, 2026, with the two edge markers the map draws, A and B.
The numbers behind the chart
- Mean flow in the zone
- 0.83 kn, setting NE
- Fastest lane the report named
- 2.37 kn NNE, 13.2 NM out
- A, slower side of the edge
- 0.5 kn, setting 40 degrees
- B, faster side of the edge
- 1.8 kn, setting 23 degrees
- Biggest change
- 1.3 kn over 4.5 NM
The mean and the fast lane are the report’s measured read. A and B are read off the map’s current layer, as of Thursday, October 8, 2 PM. They are two products with two times; see the limits below.
What the chart is showing you
Color is how fast the water is moving. The faint streaks are which way. The two round markers are the map pointing at the sharpest change in speed it can find, so you do not have to find the edge by eye.
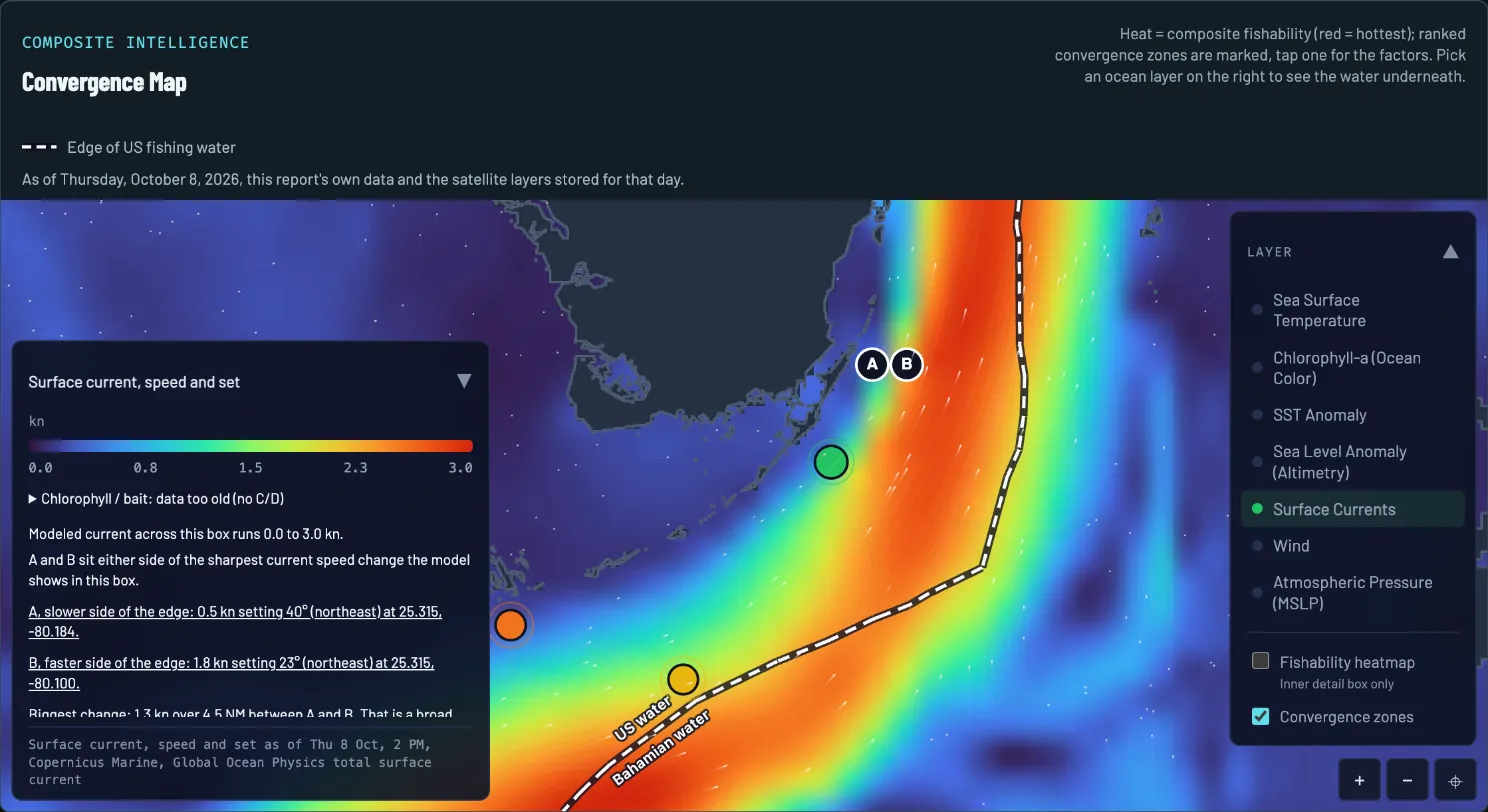
- The day. Drawn from that morning’s report and the layers stored for that day.
- Legend and layer time. Color is speed, from 0.0 knots (dark blue) to 3.0 knots (red). The stamp at the foot of the panel gives the layer’s time: Thursday, October 8, 2 PM.
- The fast water. The orange and red ribbon is the Florida Current. Faint white streaks along it show the way the water is going: northeast.
- The slow water. Blue and purple, inshore and quiet.
- The A and B markers. A sits on the slower side and B on the faster side of the sharpest change in current speed the model shows in this box.
- The readout. The panel puts A and B into words: the speed, the set and the position of each, and how big the change is between them.
- Spot 1. The report’s top pick, on the shelf where the report found a local current edge.
How to read it on October 8
Four reads, in the order a captain would make them.
-
READ 1
Read the speed first
The report’s measured read had the Florida Current setting northeast along the Keys at a mean of 0.83 knots, with fast lanes of 2.37 knots NNE 13.2 NM out, 2.36 knots NE 36.4 NM out and 2.24 knots NE 20.3 NM out from Alligator Reef. The mean is modest and the strength sits in those lanes.
-
READ 2
Find the edge
An edge is where the speed changes over a short distance. A and B mark the sharpest one this map shows: 0.5 knots on the slow side, 1.8 knots on the fast side, a 1.3 knot change over 4.5 NM. Bait and weed tend to line up along a seam like that.
-
READ 3
Look for an eddy
An eddy is a loop of water turning away from the main current, and its rim is an edge too. The report’s imagery read put a warm-core bulge 25 to 30 NM south-southwest of Alligator Reef, but it could not pin a meander at that resolution, and said so.
-
READ 4
Know what is only background
The report also carried a chart of the Stream’s shoreward edge dated October 2, six days old. It treated that line as background, not a target: nothing in the measured read put a wall at the reef itself.
What to do with it
A current edge on its own is a maybe. The report’s ranked spots count it as one edge among several: on October 8, spot 1 had a temperature break, a current edge and a chlorophyll front overlapping, which is why it ranked first. The convergence map page shows how that stacking works.
To check a spot against this chart, about a minute:
- Open the report’s map and switch it to Surface Currents.
- Find the spot’s pin. Is it on a change of color, or in the middle of one speed?
- Read the A and B readout and note which way the water is setting.
- Set that against the report’s wind. Wind blowing against a current stands the seas up, so read the forecast before you run an edge.
What the chart cannot tell you
- Two products, two times. The report’s text used the measured current read of the October 5 evening pass, which its data note counted as 57 hours old. The map layer above is a different product, stamped Thursday, October 8, 2 PM. They can disagree, and the stamp tells you which one you are looking at.
- It is modeled. The map’s own panel calls it a modeled current. It is a good guide to where the water speeds up, not a reading from an instrument at your spot.
- It is coarse. The report said it could not pin a meander at this resolution. An eddy a few miles across can hide between the cells.
- The bait data was old. The panel on this map carries its own note for that day: chlorophyll and bait data too old. A current edge with no fresh water color behind it is half the picture.
What this looked like on the water
That morning’s report named two edges worth fishing: the local current edge on the shelf at spot 1, 174 ft at the pin, and the southern eddy at spot 2, both riding the same northeast set. Its imagery read also found two small cool pockets 4 to 8 NM southeast of Alligator Reef, wrapped by warmer water, which it called worth a troll pass.
Questions anglers ask
What is a current edge?
A place where the speed or direction of the current changes over a short distance, such as a fast lane running beside slow water. Baitfish and weed gather along it, and the fish that feed on them follow. The bigger the change over the shorter the distance, the harder the edge.
How do I read the colors and the arrows on a current chart?
The colors are speed, in knots, against the legend. The small streaks or arrows are direction. A current is named for where it is going, not where it comes from: a set of 40 degrees means the water is moving toward the northeast, which is the opposite of how a wind is named.
What is an eddy and why does it matter?
A loop of water that turns away from the main current. Its rim is a current edge that curves, and the water inside is often a different temperature and color from the water outside. On a sea level chart a warm eddy shows as a high and a cool one as a low, which is the subject of the next page, the sea level anomaly guide.
What do the A and B markers on the map mean?
They sit either side of the sharpest change in current speed the map’s model shows in that box. A is the slower side and B the faster side. The panel beside the legend reads out the speed and set at each and the size of the change between them, so you can find the edge on the water without guessing where the colors meet.
Report Guide Library
Learn each chart, one real day at a time
- Read now Convergence map How do I find where fish stack up offshore?
- Read now Sea temperature How do I read a sea temperature chart for fishing?
- Read now Chlorophyll and water color What does chlorophyll tell me about where to fish?
- You are here Currents How do currents and eddies help me find fish?
- Read now Sea level What is a sea level anomaly chart and why should anglers care?
See your water tomorrow morning
Pick your water and get a free report with its own convergence map and three ranked spots.
FishIntel is for information only. It is not for navigation or safety-of-life decisions.