Guide
How to Read Your FishIntel Report
A report is short on purpose. Here is what is in it, what the numbers mean and what to do with it on the water. Examples come from our sample report, a real report for Alligator Reef written on October 2, 2026.
Here is a real one, Alligator Reef on Friday, October 2, 2026, taken apart in four stops.
What is in a FishIntel report?
Every morning FishIntel builds a report for the water you picked. It reads the satellites, the buoys, the National Weather Service marine forecast and the weather and wave models for your zone, finds where temperature, color and current line up, and writes it up the way a captain would tell you at the dock. It is written for your zone, not for the whole coast.
The 60-second tour
Stop 1 of 4Stop 1 of 4: Top of the report
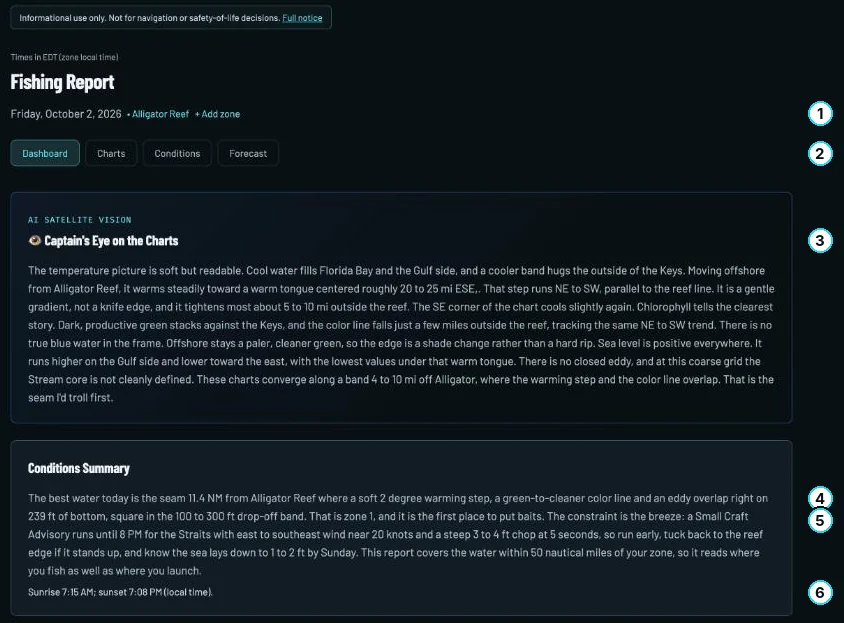
What is at the top of the report?
Read it top down: where you are, what the charts say, then the plan.
- Day and zone. One zone, one morning, in the zone’s local time.
- Tabs. Dashboard is the report; Charts, Conditions and Forecast hold the detail.
- Captain’s Eye on the Charts. A second opinion on the water, not the ranking.
- The best water. On October 2: a seam 11.4 NM out where temperature, color and an eddy overlapped on 239 ft.
- What limits the day. A Small Craft Advisory until 8 PM: run early, tuck back if it stood up.
- Sunrise and sunset, local time.
Stop 2 of 4: The three spots
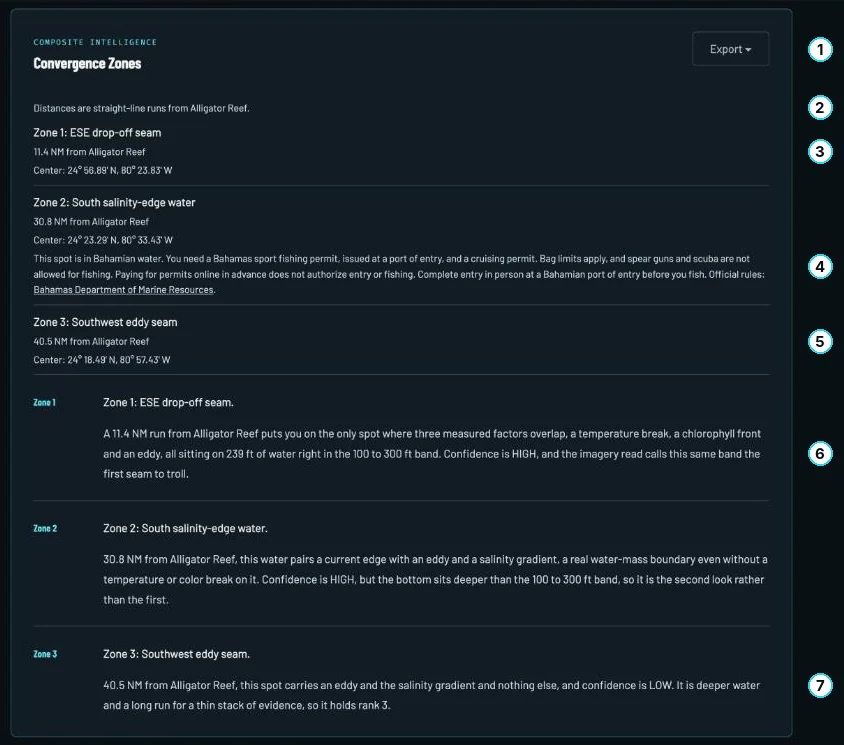
How do I read the three spots?
Up to three places, best first, where several edges stack in the same water.
- Export. Paid reports export the spot centers as GPX for your plotter.
- How the run is measured. A straight line from the landmark. Not a route.
- Spot 1, ESE drop-off seam. 11.4 NM.
- Spot 2 is in Bahamian water. The report says so and lists the permits.
- Spot 3, Southwest eddy seam. 40.5 NM, the longest run.
- Why spot 1 is first. Three edges on 239 ft, a short run. HIGH.
- Why spot 3 is last. Two edges, deeper, 40.5 NM. LOW.
Stop 3 of 4: Upcoming days
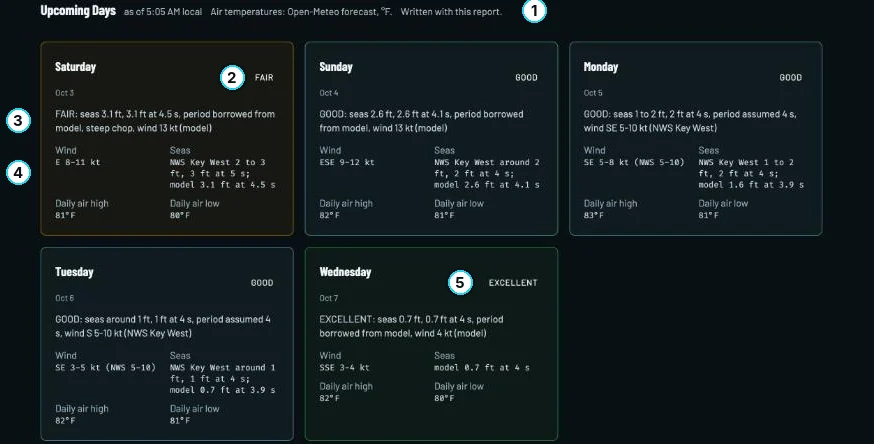
How do I read a forecast day?
Five days ahead, each rated for the boat ride, not the fishing.
- When it was written. With the report, at 5:05 AM local. For the latest, open the Forecast tab.
- The rating. EXCELLENT, GOOD, FAIR or POOR.
- The reason line. Saturday reads FAIR: seas 3.1 ft at 4.5 seconds, a steep chop.
- Wind and seas, with their source. The NWS Key West forecast beside the model’s number.
- The best day. Wednesday, seas 0.7 ft and wind 4 kt: EXCELLENT.
Stop 4 of 4: Data notes

What do the notes at the bottom mean?
Where the numbers came from and how fresh they are. Read it before you trust a chart.
- How old each layer is. Sea temperature 48 hours, chlorophyll 38. Cloud often holds color back a day or more.
- No layer is stale. When one is, or came from a backup, give that chart less weight.
- Your station. Alligator Reef’s buoy was down, so conditions came from Bob Allen, 9 NM away.
- Modeled values. Wave height, period and direction came from a forecast model.
- Calibration. Whether the fish bands were checked against this zone’s own water.
- Regulations. Confirm current regulations before you keep a fish.
What does the day rating mean?
The rating is about the day on the water, not the fishing. It reads EXCELLENT, GOOD, FAIR or POOR from the seas, the wave period, the wind and any marine advisory, for the daytime window (6 AM to 8 PM). The day takes the worse of the seas and the wind. A single hour over 20 knots counts as FAIR on wind when that day's National Weather Service forecast stays under 20 knots with no advisory, and counts in full on days the forecast does not reach.
Seas
- EXCELLENT, under 2 ft
- GOOD, 2 to 3 ft
- FAIR, over 3 ft, under 6 ft
- POOR, 6 ft and up
Wind (sustained)
- EXCELLENT, under 10 kt
- GOOD, 10 to 15 kt
- FAIR, over 15 kt, up to 20 kt
- POOR, over 20 kt
Try it: pick the seas and the wind, and see how the day reads.
SEAS
WIND, SUSTAINED
Period matters because the same height rides differently. A long swell under 8 ft can ease the seas by a step. Short, steep chop of 3 ft or more holds the day to FAIR at best, and steep seas of 5 ft or more make it POOR. A marine advisory or warning makes it POOR whatever the numbers say.
The reason line under the rating names the figures that set it. On the sample day the zone wave read was 3.7 ft every 4.9 seconds, with east to southeast wind near 20 kt and a Small Craft Advisory until 8 PM. The advisory alone makes the day POOR. Run through the rule, that reads:
POOR: Small Craft Advisory until 8 PM (National Weather Service)
A rating is a start. You still read the forecast and the advisories, and you still hold the numbers against your own boat. A rating never tells you it is safe to go.
How do I read the three spots?
The report ranks up to three places inside your zone’s circle, best first, where several favorable things stack in the same water: a temperature break, a color change, a current edge. If a spot sits outside your circle, the report marks it “outside your zone.” A much longer run has to be clearly better than a nearer spot to outrank it.
Beside each spot you get the run in nautical miles from a named landmark, or from the center of your zone, and the spot’s center in degrees and decimal minutes, ready for a plotter. Paid reports can also be exported as GPX.
On the sample day, spot one was the ESE drop-off seam, 11.4 NM out, where a temperature break, a chlorophyll front and an eddy overlapped on 239 ft of water. Spot two was South salinity-edge water, 30.8 NM out, a current edge, an eddy and a salinity gradient on deeper bottom. Spot three was the Southwest eddy seam, 40.5 NM out, with low confidence because it rested on an eddy and a salinity gradient only, and the report said so. The report tells you how much weight each one has, so read the reasoning and not just the order.
How to run them. Start at the nearest. Work the edge itself rather than the middle of either side, and fish both sides of it. When the water changes, a color line moves, the temperature drops off or the current slacks, move to the next spot instead of waiting on the first.
What do the charts show?
Sea surface temperature
Look for a place where the colors change fast over a short run. A break of a degree or two across a few miles is an edge that holds bait. A wide, even field of one color is just warm or cold water.
Chlorophyll (water color)
Green water holds bait and blue water holds the fish that commute through it. The line between them is the front. Sharp and tight is better than soft and spread out, and a green edge that sits seaward of the reef is a different thing from bay water running out.
Currents
Find where the flow speeds up, bends or slides past slower water. Those edges and the eddies that spin off a major current stack bait. Sea level height charts show the same thing as ridges and troughs.
Trust the charts on your dashboard. Each one is dated, and it shows the newest satellite pass there is. The pictures in your email are a snapshot: they carry the words “Current as of” and a time, and they do not update. Satellite color is often a day or more old under cloud, so the report states how old each layer is.
Report Guide Library
Go deeper, one chart at a time
- Read now Convergence map How do I find where fish stack up offshore?
- Coming Sea temperature How do I read a sea temperature chart for fishing?
- Coming Chlorophyll and water color What does chlorophyll tell me about where to fish?
- Coming Currents How do currents and eddies help me find fish?
- Coming Sea level What is a sea level anomaly chart and why should anglers care?
What do the species labels mean?
Each species gets HIGH, MODERATE or LOW for the day, with a short reason: the water temperature against that fish’s band, the season and how the water is set up today.
Calibrated means a temperature band was checked against a season of observed water from the fishery. In the Florida Keys that is Mahi, Wahoo and Sailfish, from 100 days of observed sea surface temperature recorded between 4 April and 27 July 2026. Drafted means the band comes from published fisheries sources and has not yet been checked against local water. Every report says which one applies to your zone, so treat a drafted band as a careful starting point and lean on the season as much as on the number. Some fish, like swordfish, are not driven by surface temperature at all, and the report says that instead of inventing a band. The species pages show the bands.
Seasons, size limits and bag limits change. Confirm current rules before you keep a fish. Seasons, size limits and bag limits in this report are a guide and can change at any time. Confirm current regulations with the state or federal agency before you fish or keep a fish; knowing and following them, along with any license or permit, is your responsibility. Official rules: FWC, NOAA Fisheries.
What should I do the night before and the morning of?
-
Night before
open Upcoming Days and read tomorrow’s rating and its reason line.
-
Night before
open your dashboard and read the live marine alerts, wind and seas for your water, then hold them against your own boat’s limits.
-
Morning
when your report lands (paid plans: by 6 AM your time), read the Conditions Summary first (the sample report calls it The Short Version), then the three ranked spots.
-
Morning
check the age of the charts. Anything the report calls old gets less weight.
-
Before you leave the dock
put the three spot centers in your plotter and pick the nearest as your first stop.
-
Before you keep a fish
confirm current seasons, size limits and bag limits with the agency.
Where do I ask a question?
Paid readers can ask the FishIntel assistant on Telegram about their own zone in plain language, for example “where’s the bite today?” or “how far is the Gulf Stream edge?” It answers from your zone’s report, not from a general chatbot. Set it up under Account in your dashboard.
Everyone can write to us at support@fishintel.ai or use the contact page.
See one for your own water
Read the full sample first, or pick your water and get a free report.