Report Guide Library · 3 of 5
What does chlorophyll tell me about where to fish?
Where the water is green, there are plants, and where there are plants, there is bait. Where it is blue, the water is clean and the pelagics travel. The line between them is where to fish, and the edge beats the middle of the green.
This page takes one real chart apart: Molasses Reef, Wednesday, October 7, 2026, a day with a full chlorophyll read to work from.
The numbers behind the chart
- Zone average
- 1.53 mg/m3
- Heaviest cell
- 88.6 mg/m3, far outside the zone
- The report’s chlorophyll front
- 9.3 NM out
- Where the water turned cleaner
- 5 to 10 NM seaward of the reef
- Age of the layer in the report
- 45 hours, from a backup source
From the report’s own data: 1,366 satellite points, Molasses Reef, October 7, 2026.
What the chart is showing you
Every color on the chlorophyll layer is an amount of chlorophyll, and the legend says how much. Bright green is plenty, deep blue is little. You are looking for the place where one turns into the other.
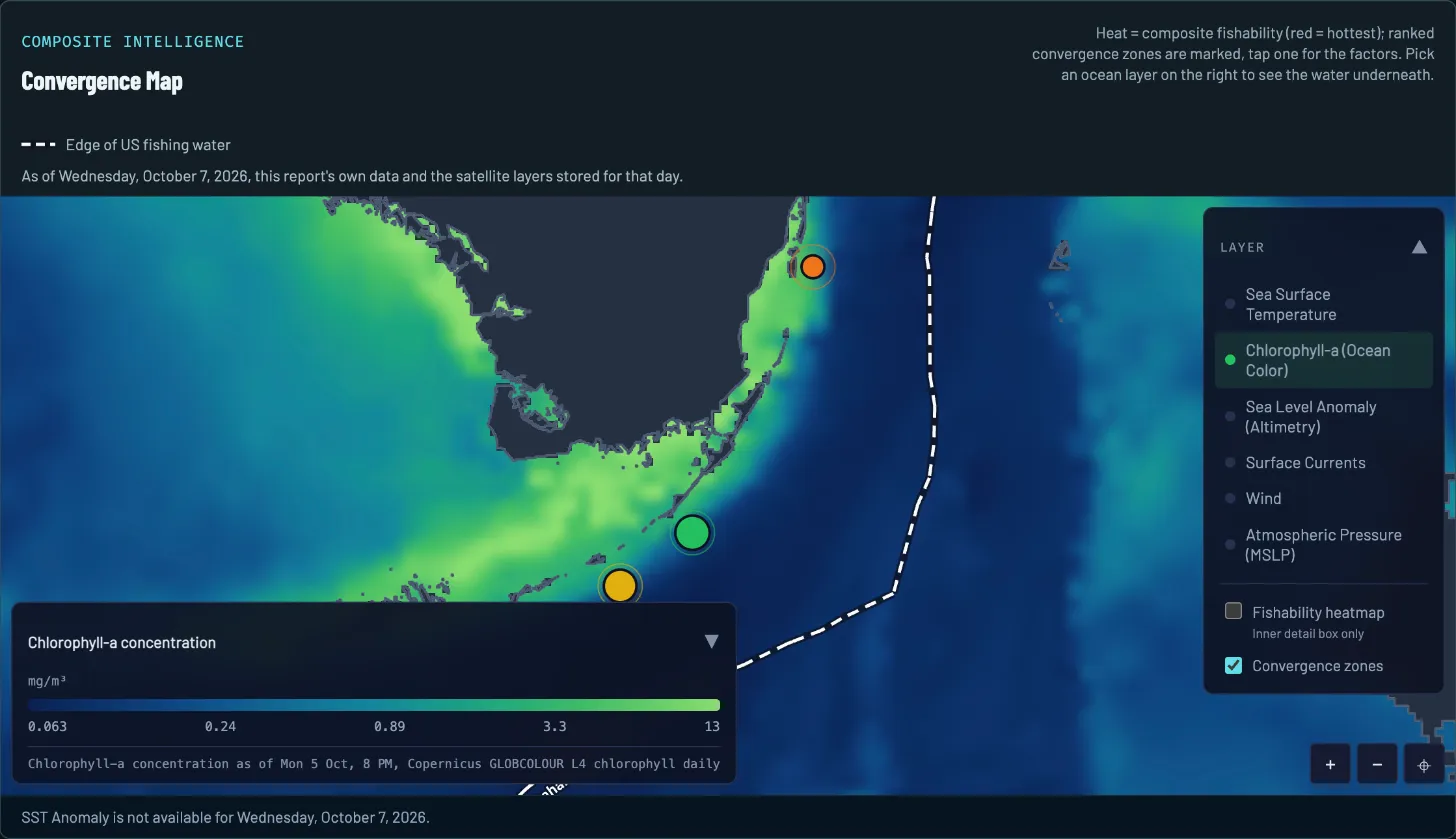
- The day. Drawn from that morning’s report and the layers stored for that day.
- Legend and layer time. Chlorophyll in mg/m3, from 0.063 to 13. The steps are uneven, about four times each. The stamp under the bar says the satellite saw this water on Monday, October 5, 8 PM.
- Green water. Along the reef tract and the coast: productive water, where the bait chain starts.
- Blue water. Dark blue is the low end of this legend: low in plankton, where pelagics travel. On this map it lies farther offshore, east and southeast of the reef-side green-to-teal stretch the report described.
- Spot 1. The report’s top pick, 9.3 NM out, on the front where green starts to thin.
- The color line. Green fades to teal and then blue over a few miles. A gradual change, not a hard line.
- Layer picker. Switch the water underneath. Sea Surface Temperature and Surface Currents are in this list.
How to read it on October 7
Four reads, in the order a captain would make them.
-
READ 1
Read the legend first
The steps on this legend are 0.063, 0.24, 0.89, 3.3 and 13 mg/m3. Each is roughly four times the one before, so a patch that looks only a little greener can hold several times the chlorophyll. Read the colors against the legend, not against another day’s chart.
-
READ 2
Find where the green thins
Green water hugged the reef tract and the bay side. The imagery read had the water turning cleaner and lighter several miles seaward of Molasses, about 5 to 10 NM, with nothing within that stretch reading truly blue in the satellite imagery it analyzed. The dark blue on this map lies farther offshore, east and southeast of that stretch. The report called the change gradual to moderate rather than a hard line.
-
READ 3
Ignore the extremes
The zone averaged 1.53 mg/m3. The heaviest cell, 88.6, sat far outside the zone up the Gulf side, well above anything this legend draws. The report’s words: do not chase those big numbers.
-
READ 4
Fish the edge, not the middle of the green
Green water holds the bait, so the fishable edge is where the reef-tract green thins into cleaner water. The report’s plan was the first clean water outside the 30 ft contour, which is where its chlorophyll front sat, 9.3 NM out.
What to do with it
A color line on its own is a maybe. The report’s ranked spots count it as one edge among several: on October 7, spot 1 had a temperature break and a chlorophyll front overlapping. The imagery read put the warm band’s inner edge and the color line together 5 to 8 NM southeast of Molasses Reef, and the report’s advice was to work that seam. The convergence map page shows how that stacking works.
To check a spot against this chart, about a minute:
- Open the report’s map and switch it to Chlorophyll-a (Ocean Color).
- Find the spot’s pin. Is it on the line where green turns to blue, or in the middle of one color?
- Read the layer’s time under the legend. Chlorophyll can be days old by the time the report is written.
- Switch to the temperature layer. A color line that sits on a temperature step is a much better bet than either alone.
What the chart cannot tell you
- Two products, two times. This map’s stamp names Copernicus GLOBCOLOUR L4 chlorophyll daily, as of Monday, October 5, 8 PM. The report used a different chlorophyll product: its source note names VIIRS DINEOF gap-filled chl-a daily, observed October 5 at 12:00 UTC. Its data note counted that read at 45 hours old and said it came from a backup because the preferred source was unavailable.
- Cloud hides it. A satellite cannot see water color through cloud. The report’s VIIRS DINEOF backup was a gap-filled product, so some of that chlorophyll read was estimated where cloud hid the water.
- Thin reads happen. On October 2 the Alligator Reef report’s chlorophyll read covered only 3 data points. The report said so and leaned on the satellite imagery for the color line instead. A thin read is a reason to trust the line less, not more.
- Near shore, color is not only plankton. Close to the coast, sediment and shallow bottom also change the color, so the biggest inshore numbers are not a guide to bait.
- It is one clue. Chlorophyll tells you about the plant life in the water. It does not tell you where fish are standing or whether the day is fishable.
What this looked like on the water
That morning’s report told anglers to fish the first clean water outside the 30 ft contour, where its chlorophyll front sat 9.3 NM out, and to work the seam 5 to 8 NM southeast of Molasses Reef where the warm band and the color line overlapped. Its imagery read found nothing truly blue within the 5 to 10 NM stretch seaward of the reef that it described; the dark blue on this map lies farther offshore, east and southeast of that stretch. So the target was a shade change near the reef, not a blue-water edge.
Questions anglers ask
What is chlorophyll, and why does a fishing chart show it?
Chlorophyll is the pigment in the tiny plants that drift in the water. A satellite reads it as color: more chlorophyll turns the water greener. Plankton feeds baitfish and baitfish feed the fish you want, so green water is where that chain starts.
Is green water or blue water better for fishing?
Neither, and both have a job. Green water holds the bait. Blue water is clean and low in plankton, and it is where pelagics tend to travel. The place to fish is the edge between them, where bait and the fish that eat it share the same water.
What do the numbers in mg/m3 mean?
Milligrams of chlorophyll in a cubic meter of water. There is no good or bad number. The scale is uneven, so each tick on the legend is about four times the last. On October 7 the zone average was 1.53 and the cleanest cell read 0.03. What matters is where the number changes, not the number.
Why does my chlorophyll chart look patchy or out of date?
Satellites cannot see water color through cloud, and each layer is stamped with the time of the pass that made it. The map shows that stamp under the legend, and the report’s data note counts the age of every layer it used. Check them before you trust an edge.
Report Guide Library
Learn each chart, one real day at a time
- Read now Convergence map How do I find where fish stack up offshore?
- Read now Sea temperature How do I read a sea temperature chart for fishing?
- You are here Chlorophyll and water color What does chlorophyll tell me about where to fish?
- Read now Currents How do currents and eddies help me find fish?
- Read now Sea level What is a sea level anomaly chart and why should anglers care?
See your water tomorrow morning
Pick your water and get a free report with its own convergence map and three ranked spots.
FishIntel is for information only. It is not for navigation or safety-of-life decisions.